Piezometric Time Series or Piezometric Graph
The piezometric time series shows how the level of a monitored body of water or piezometric level has developed over time (see piezometric level). It is made up of measurements linking the level of the body of water to a given date. Depending on the variability of the level of the body of water, measurements are taken more or less frequently.
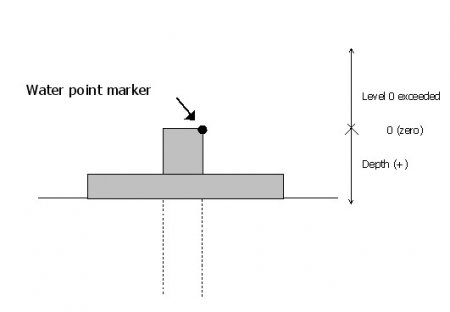
Measurements obtained are positive or negative in relation to the measuring mark. They are positive when the level of the body of water is below that of the measuring mark (most frequent scenario). They are negative when the opposite scenario occurs (Artesian wells).

Artesian: a borehole is artesian if the water spurts from it.
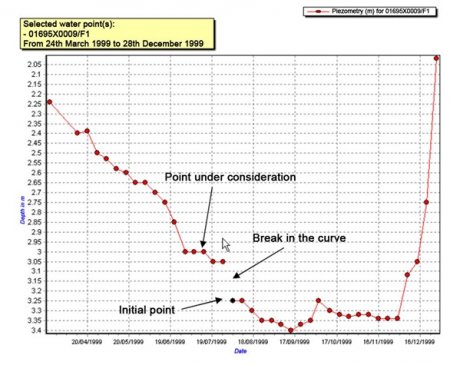
A time series is represented by a curve which is discretised in order to be stored in a succession of points, with each point representing the level of the body of water at a given moment.
The points are linked to each other using a code which indicates whether the point is connected to the previous point in time. If the point is not linked, it constitutes an initial point on a new section of the time series. The presence of an initial point is also symptomatic of a lack of information about the level of the body of water during the period between the initial point and the previous point.


